After you have created a scenario in the platform, Vibrant Planet provides project statistics to help you better understand the proposed projects. In a previous scenario where we prioritized safety and assets at a 4 out of 5, the project statistics show that we are able to treat 21% of the planning area and achieve 55% of the available Resilience
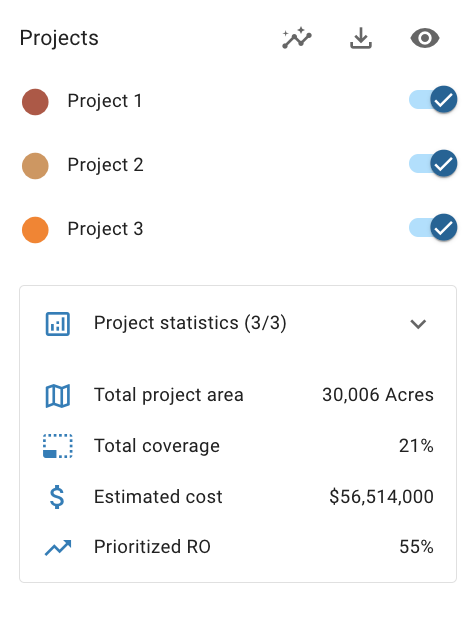
Opportunity (RO). This means that of the 100% of the available RO, this set of projects unlocks 55% of the RO for your emphasized objectives across the entirety of the planning area.
You can take a deeper look at your scenario and project specific details including a graph which displays how much of the planning area you would need to treat to achieve maximum value for your emphasized objectives. In this scenario, if you were to treat 60% of the acres in the planning area you would achieve 100% of the RO for safety and assets. In addition to this graph, Vibrant Planet displays scenario land ownership and treatment method distribution, and detailed financial information.
 In addition to the project statistics for individual scenarios, the platform also provides specific consensus scenario statistics. The platform provides a graph that displays the RO for each objective across each individual scenario as well as the consensus scenario. In this complete consensus instance, biodiversity and ecological commodity objectives are achieving the greatest percentage of their potential RO across the planning area.
 In the next and final section of our series, explore how you can download your project data and get one step closer to implementation in the field!