Learn the Methodology
  1. Knowledge Center
  2. Learn the Methodology

10 Build prioritized, sequenced project plans

In the previous section, we explored the ways that partners can plan to emphasize different objectives. Each of the eight objectives can be weighed from zero to five.

After you’ve emphasized your objectives, the platform has nearly all of the information it needs to build you and your team a scenario. Below is an example scenario that prioritizes assets and safety three times higher than everything else, the platform shows the highest-impact opportunities to reduce risk. 

Remember, the risk reduction opportunities map is the result of all the data you and your partners have provided, such as your SARAs and DMAs. The map shows these values, plus the values included on every base map, and their risk


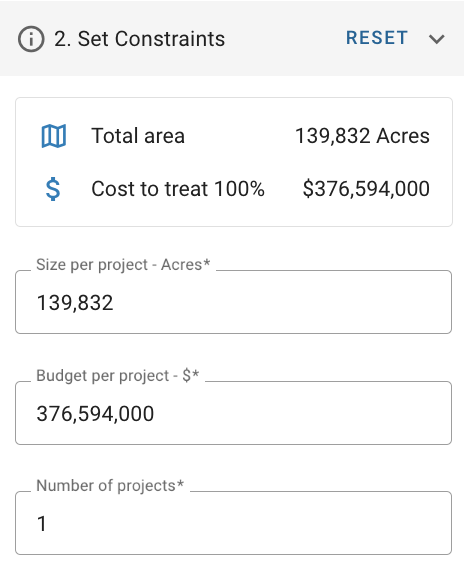
In an ideal world, you and your team would be able to treat this entire area with unlimited personnel and budget. For example, the analysis area above is over 139,832 acres, and would cost over $376 million to treat entirely. However, we know resources are limited, and you need project plans that are feasible to implement. The final step is constraining your projects based upon your available resources.These constraints include the number of acres you’d like each project to be approximately sized, the dollar amount you can spend per project, and the number of projects. You are able to build your scenario using two of the three constraints. For this example, we’ve set these constraints at 4 total 10,000 acre projects costing $100,000 each. 

Click “Create Scenario” and Vibrant Planet creates your scenario. To continue our example, across the 139,832 acres, the platform has helped you and your partners hone in on three prioritized projects spanning 30,000 acres.

This series of prioritized projects is known as a scenario. Because we know many partners may want to set different priorities and constraints, Vibrant Planet makes it possible to build many different scenarios on a planning area and compare them. This way, you can build the most comprehensive plan that truly takes into account every partner’s priorities. 

Science Corner: ForSys


This specific sequenced modeling is powered by the Rocky Mountain Research Stations (RMRS) ForSys, which Vibrant Planet co-iterates and co-develops on thanks to our Cooperative Research and Development Agreement (CRADA) with RMRS. With ForSys, the platform calculates estimated treatment costs, appraised product benefits, projected workforce requirements and land ownership which can be found under project statistics. 

FORSYS-Deep Dive

The user may choose to constrain by project size, by cost, or by both, user input is required on at least one. Leaving the field at the maximum (the default value provided) leaves that factor unconstrained during Scenario optimization.

These parameters, along with the cumulative weighted RROI for each STELA polygon in the Planning Area, are

passed to the ForSys algorithm to build projects (number dependent on user-input) that optimally group adjacent

polygons to maximize the cumulative weighted RROI for each project. ForSys, developed by the U.S. Forest Service,

is a scenario planning model for multi-objective restoration that is spatially explicit and uses multi-criteria prioritization and optimization to design project areas. The model analyzes prioritization problems at multiple scales ranging from planning areas to districts, forests and regions. In Land Tender, each project grows in size based on the

constraints that the user passes: either acreage per project or budget per project. The project will stop growing in size (accumulating polygons) when it reaches the user-defined size or cost constraints, whichever occurs first.

How Product Benefit works


 Product benefit, provided in US dollars, is a function of the estimated product removal, an estimated market value, and

the distance to the nearest sawmill. The market value of the product removed is roughly estimated to be $550 per

MBF. Since market value is highly variable, this value should only be used for high level planning purposes.

If estimated removal is zero, based on the management unit characteristics and prescription being evaluated, then

product benefit is also set to zero. If estimated removal is greater than zero, then product benefit is calculated by multiplying the Estimated Removal (MBF) by the Estimated Market Value of $550/MBF. It is then reduced to 75% of the

calculated value if the management unit is further than 100 miles of the nearest sawmill (distance to nearest mill represented as dstmill_mi); this helps to account for the costs of transportation of product to a mill distant from the management unit.

In the next section, we’ll explore the ways to compare scenarios and get to consensus.